Reporting
In the Reporting section of SPX, you can generate reports on various KPIs and metrics, as well as export the results to a CSV file.
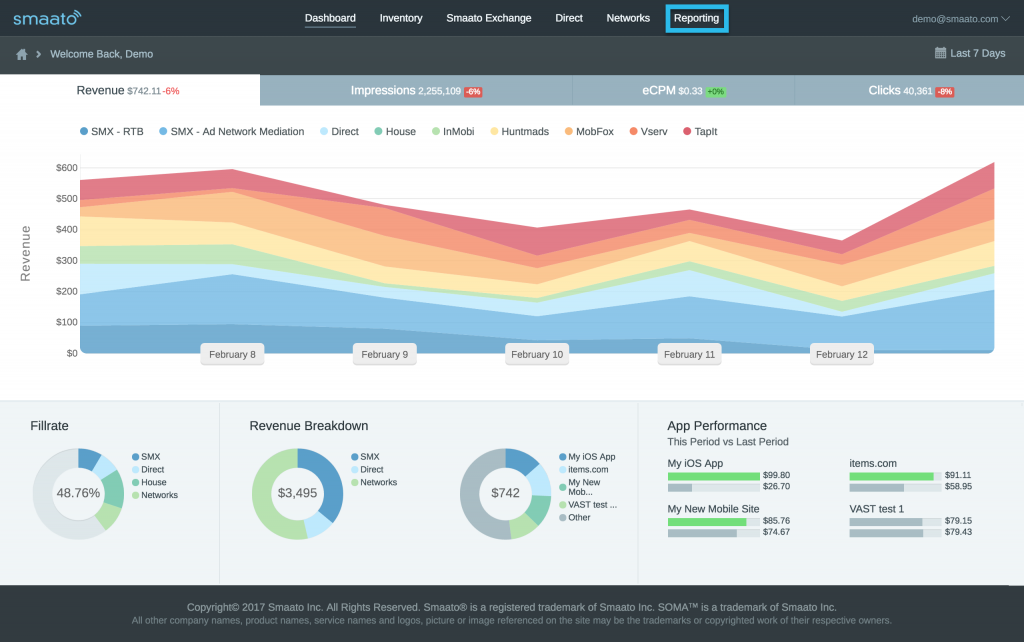
Click on the Reporting tab in the SPX main navigation.
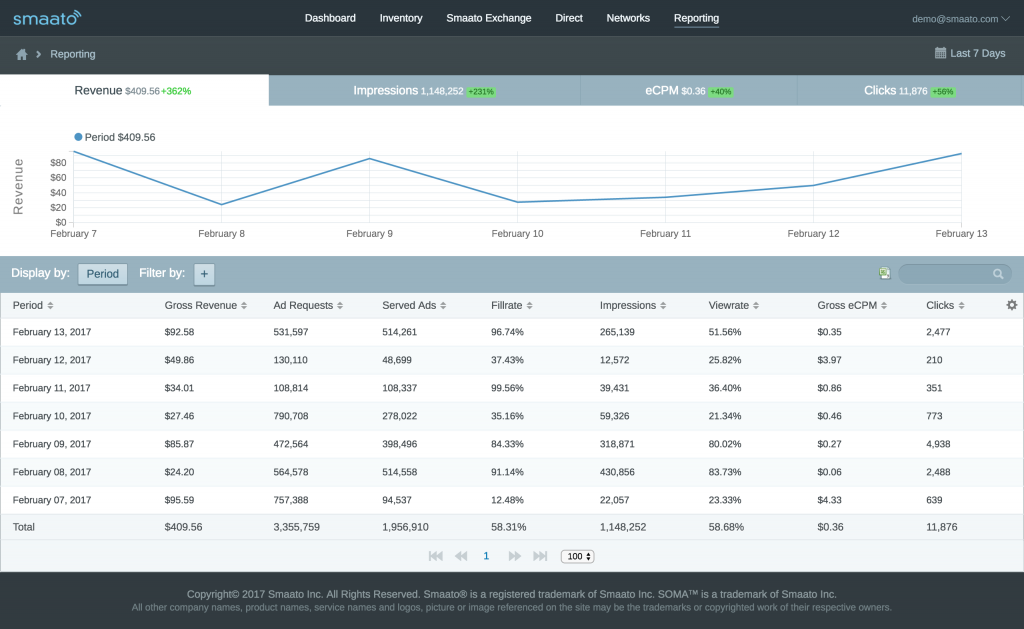
By default, you’ll see a daily breakdown of the past seven days.
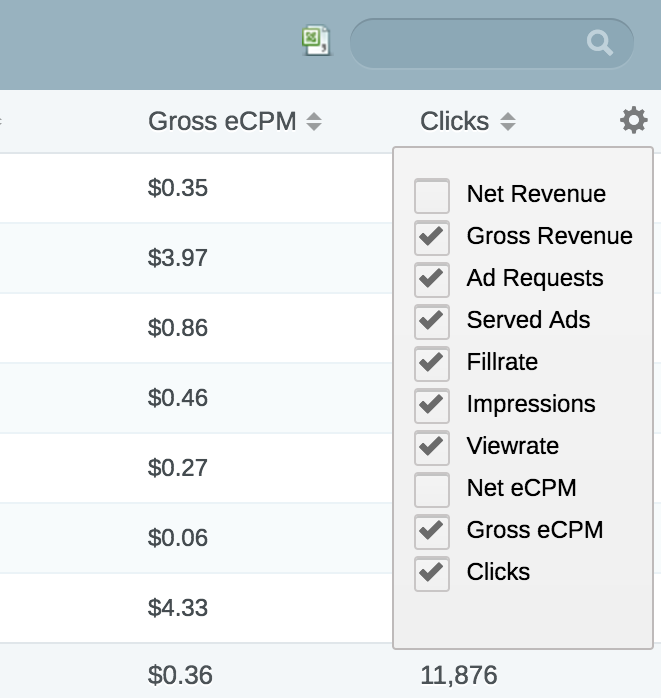
Gross and Net Revenue
By default, we’re showing gross values for revenue and eCPM. You can also switch to net values, or show both if you’d like by clicking the cog icon at the far-right end of the table.
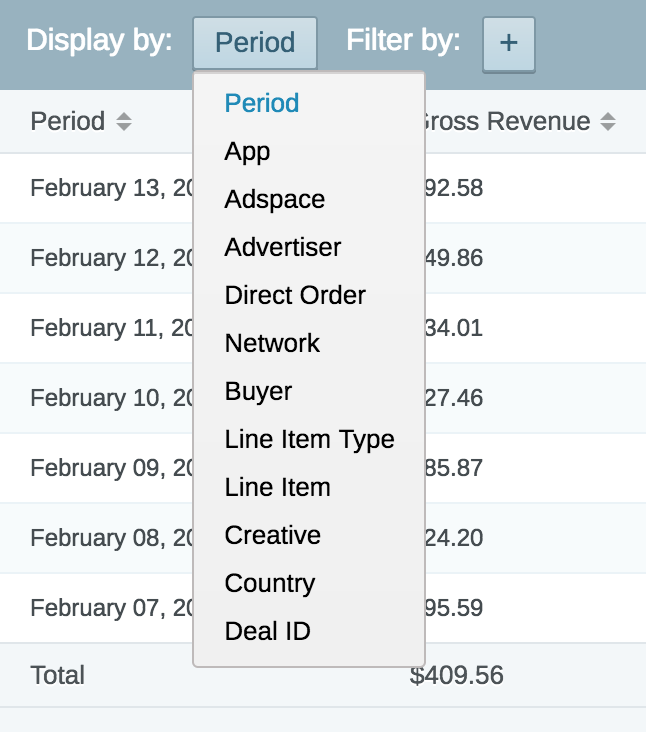
Dimensions
Also, by default, reporting is displayed by period. Click the field to choose another reporting dimension (i.e., if you would like to see numbers sorted by apps).
Filters
You can also filter results by a number of dimensions (e.g. if you’d only like to see reporting for one specific app)
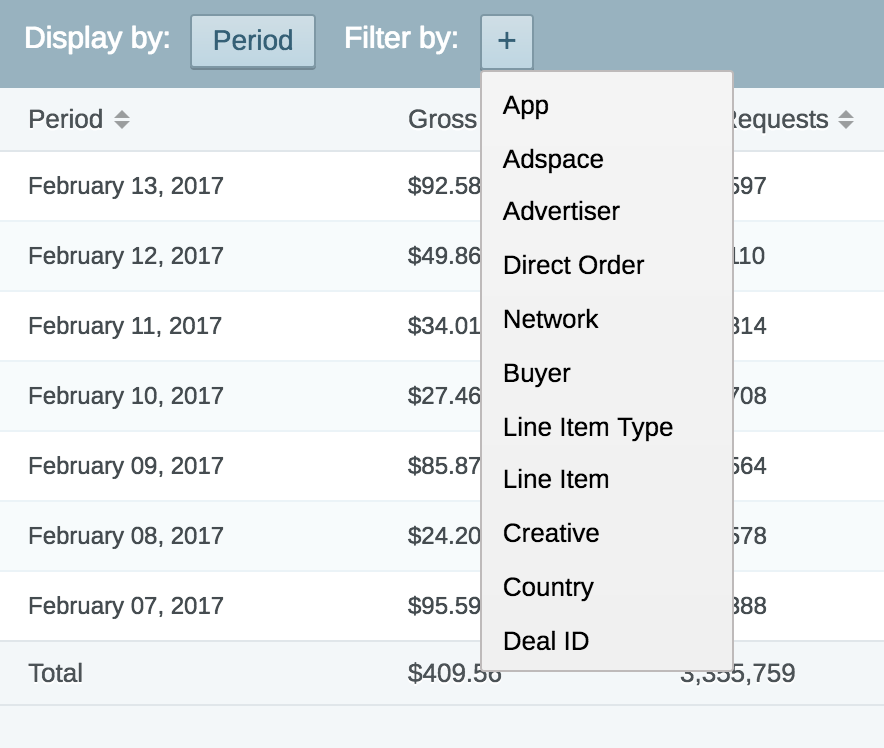
Time Frames
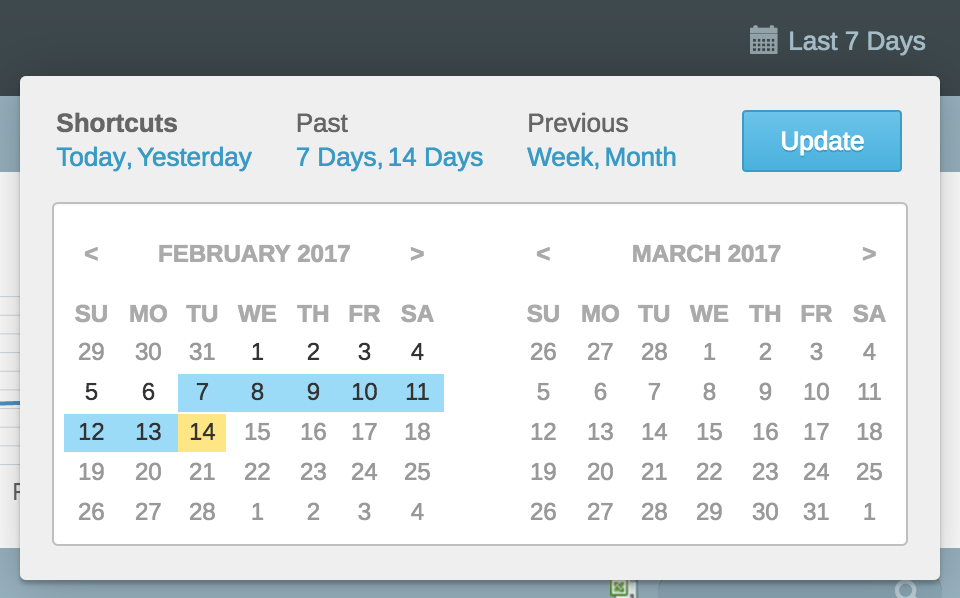
Of course, you can also change the time frame – choose between today, yesterday, past 7 days, past 14 days, the previous week and previous month, or pick a specific date or date range.
Search & CSV Export
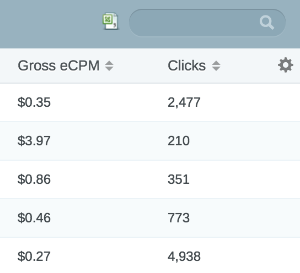
You can also keyword-search the currently used dimension via the search bar on the right to close in on specific entries. When you’ve got the report you need, click the file icon next to the search bar, and you’ll receive a CSV.
Example: Monthly Apps Report
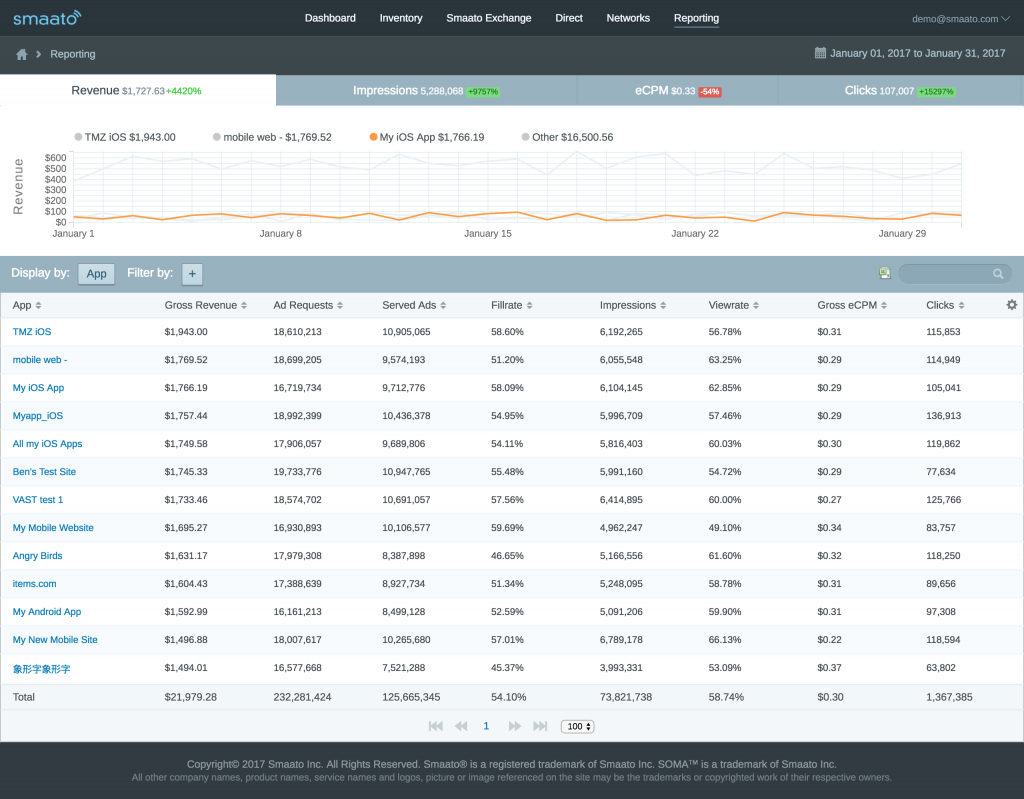
Head over to the Reporting section. On the page, switch the dimension (toggle next to Display by: ) to app.
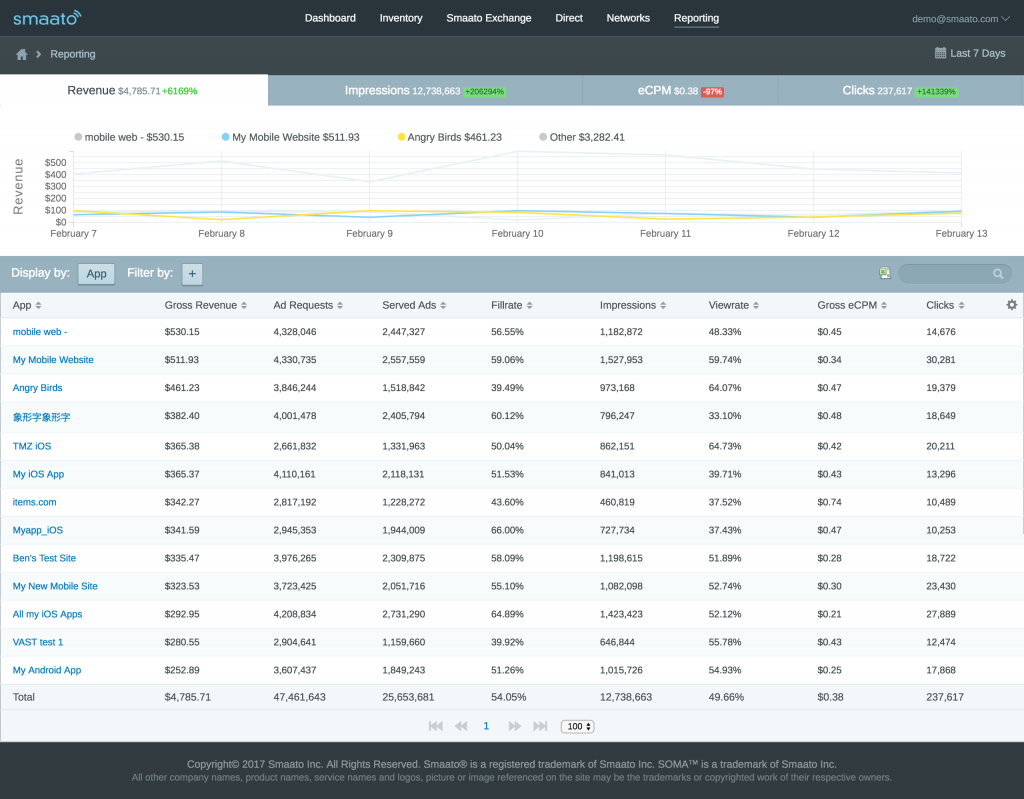
Then, let’s switch the time frame to the previous month.
Now, just hit the file icon, and you’ll get a CSV of the above report!
The CSV import isn’t sensitive to the metrics selection in the UI, which means it’ll always contain both Gross and Net Revenue and eCPM, as well as all other metrics.
Last Modified: August 31, 2023 at 11:50 am