Deal Reporting
Overview
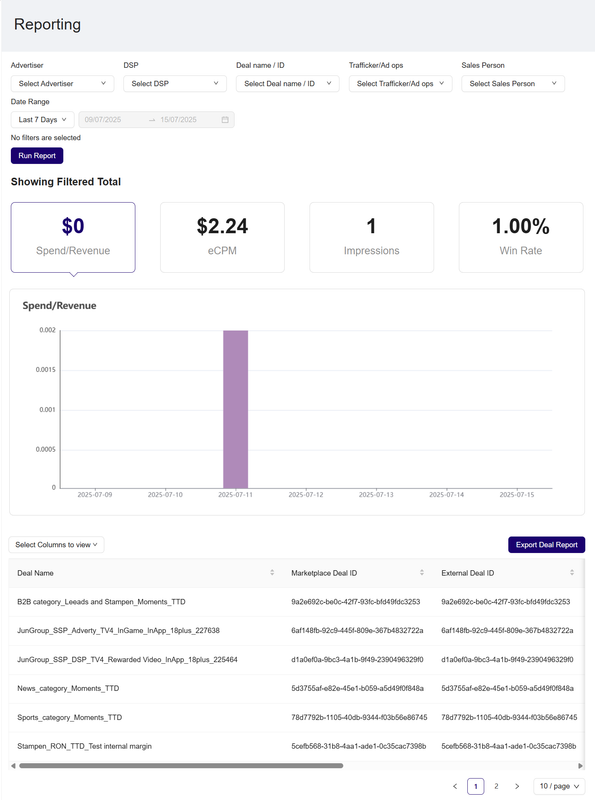
The Reporting Dashboard allows you to view detailed metrics related to deal performance. It keeps track of key performance indicators (KPIs), such as Spend/Revenue, eCPM, Impressions, and Win Rate. It includes filter options to generate customized reports based on specific criteria such as the Advertiser, DSP, Deal Name or Deal ID, Trafficker/Ad ops, Sales Person, and Date Range.
Using the Deal Reporting Page
The Reporting Dashboard provides the following key functions:
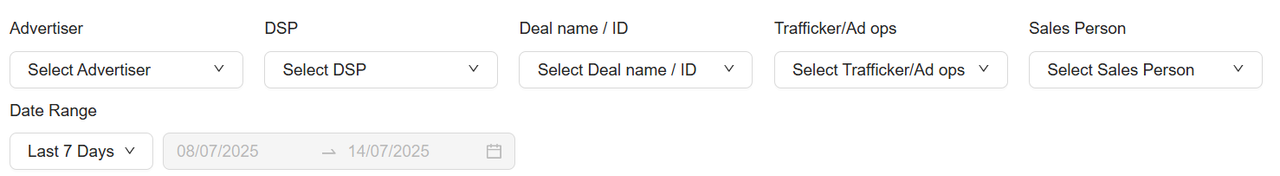
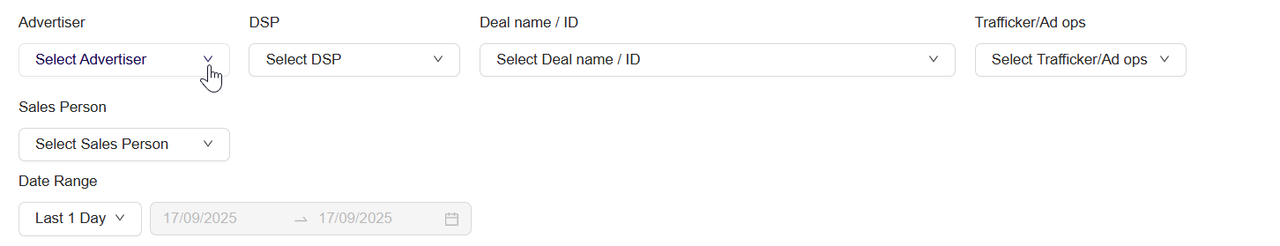
- Filter: This section enables you to customize your reports by applying various filters.
- Advertiser: Choose the advertiser whose data you want to view.
- DSP: Select the Demand-Side Platform (DSP) associated with your deal.
- Deal Name/ID: Filter reports by deal name or deal ID.
- Trafficker/Ad Ops: Filter based on the person or team managing the deals.
- Sales Person: Filter the report based on the sales personnel responsible.
- Date Range: Select the desired time period for which you want to run the report, such as custom dates, last 1 day, last 7 days, last 14 days or last 30 days.
Filter Report
- Key Metric: These key performance indicators provide a snapshot of your deal performance.
- Spend/Revenue: Displays the total amount spent or revenue generated over the selected period.
- eCPM: Displays the eCPM value based on the selected data.
- Impressions: Shows the number of impressions served during the specified timeframe.
- Win Rate: Indicates the percentage of wins in relation to the total bids.
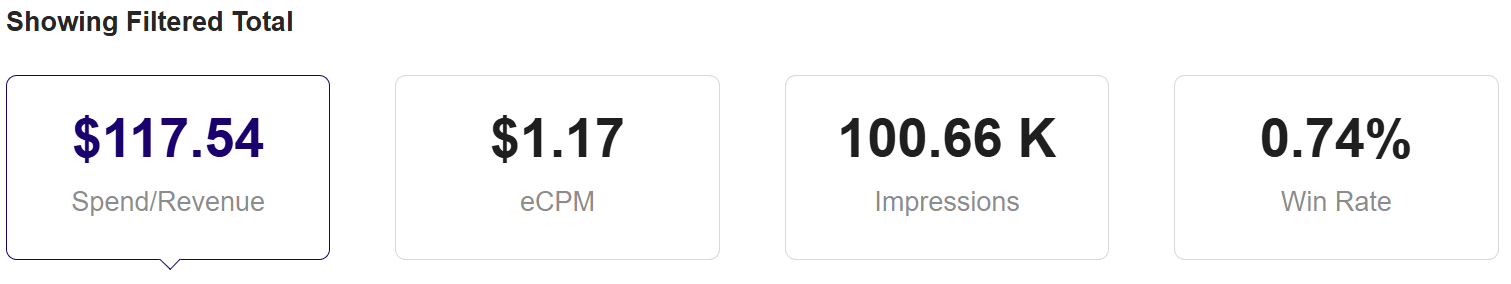
Showing Filtered Total
- Visualization: This graph displays the Spend/Revenue over the chosen date range. It helps you to visualize the trend and changes over time.
- Hover over the graph to see specific values for Spend/Revenue on different days.
- The graph is updated dynamically based on the filters applied.
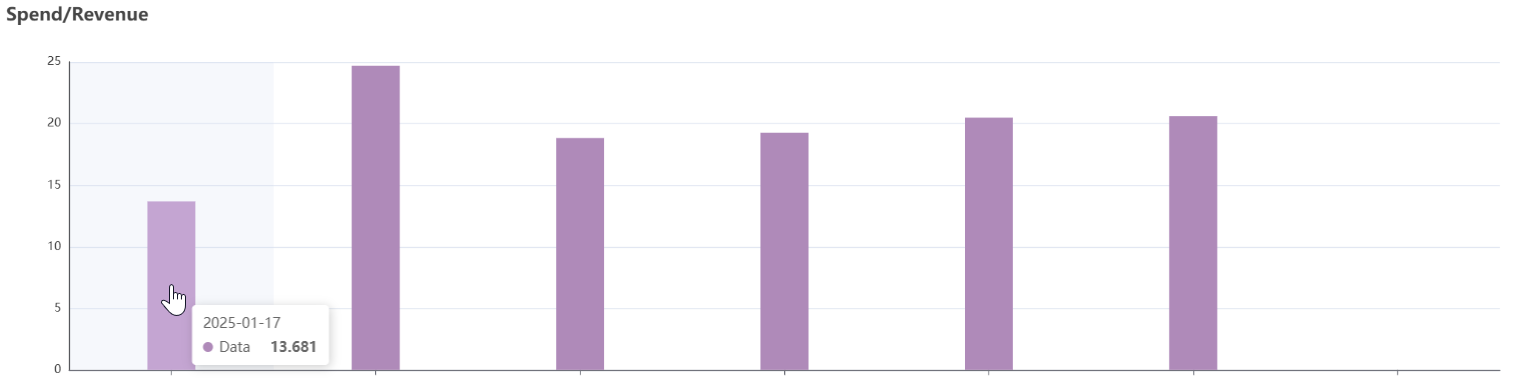
Graph Spend Revenue
- View Deal Column: The data table below the graph presents a detailed breakdown of the filtered report. The key columns include:
| Column | Description |
| Deal Name | The name of the deal. |
| Marketplace Deal ID | The unique identifier assigned to the deal within the Deal Portal marketplace. This ID is generated by the system when a deal is created. |
| External Deal ID | The identifier provided by the DSP or external system for referencing the deal outside of the Deal Portal. |
| Deal Type | Specifies the type of the deal (for example Open Deal). |
| DSP | Displays the DSP associated with the deal. |
| Advertiser | Displays the name of the advertiser associated with the campaign |
| Seat Name | Indicates the seat ID (for example 3103) for the campaign, representing the specific account or seat within the platform |
| Start Date | The starting date of the deal. |
| End Date | The ending date of the deal. |
| Status | Shows the current status of the deal. |
| Impressions | This column shows the total number of impressions served during the deal. |
| Bid Requests | Indicates the number of bid requests made during the deal. |
| Bids | Displays the total number of bids made in the deal. |
| Bid Rate | Shows the rate at which bids were made during the deal. |
| Win Rate | Represents the percentage of successful bids to the total bids. |
| eCPM | Represents the effective cost per mille. |
| Spend | The amount spent in the deal. |
| Trafficker/ad ops | The personnel or team responsible for managing the traffic or operations for the campaign. |
| Salesperson | Indicates the salesperson associated with the deal. |
| Created By | Displays who created or initiated the deal. |
You can scroll through the table to view more data. The pagination controls allow you to navigate through multiple pages if there are many records.
View Deal Detail
Prerequisite
Before running a deal report, ensure the following requirements are met:
- You are logged into the Deal Portal.
See Logging into the Portal - Deal must be in Running or Active state.
See Running a Deal
Accessing the Reporting page
- In the left-hand menu of the Dashboard page, click the
 icon.
icon.
Deal Reporting Workflow
To generate report for the deal, follow these steps:
- When you first land on the Reporting page, no filters are applied. The page will display aggregated metrics for all deals under your buyer account by default.
View Default Report
- Apply Filters
-
- Begin by selecting the desired filters at the top of the page:
- Advertiser: From the Advertiser dropdown, select the advertiser name you want to view the data or use the search box to set your filter.
- DSP: From the DSP dropdown, select the Demand-Side Platform (DSP) associated with your report or use the search box to set your filter.
- Deal Name/ID: From the Deal name/ID dropdown, select the deal name or deal ID to focus on a specific deal or use the search box to set your filter. You can enter either a Marketplace Deal ID or an External Deal ID — both are supported. The system will automatically match and return deals based on the ID you provide.
- Trafficker/Ad ops: From the Trafficker/Ad ops dropdown, select the relevant traffic or ad operations team or use the search box to set your filter.
- Sales Person: From the Sales Person dropdown , select the sales person or use the search boxes to set your filter.
- Date Range: Use the Date Range dropdown to select from preset options (e.g., Last 7 Days), or choose Custom Dates.
Apply Filter
-
- If you choose a Custom Dates, a calendar picker allows you to choose a custom start and end date.
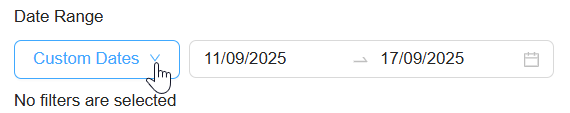
Select Custom Date
-
- Begin by selecting the desired filters at the top of the page:
- Your selected filters will appear as tags below the filter bar.
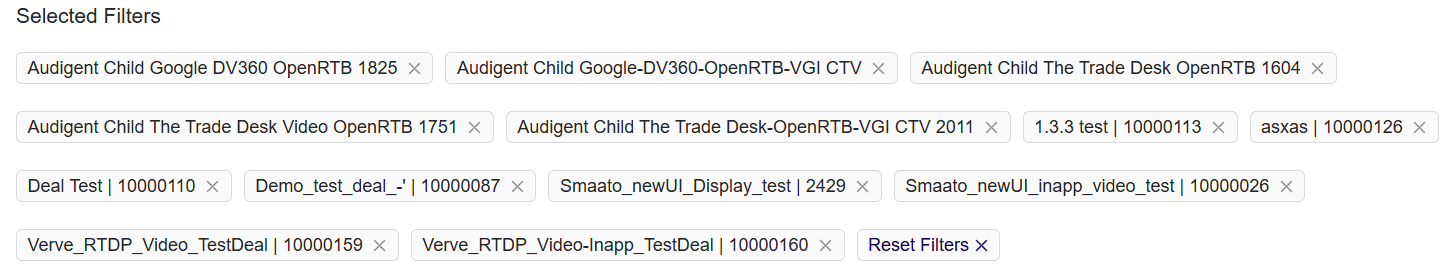
Selected Filter
- To remove a single filter, click the x icon next to the selected tag.

Remove Selected Filter
- To clear all selected filters, click Reset Filters.
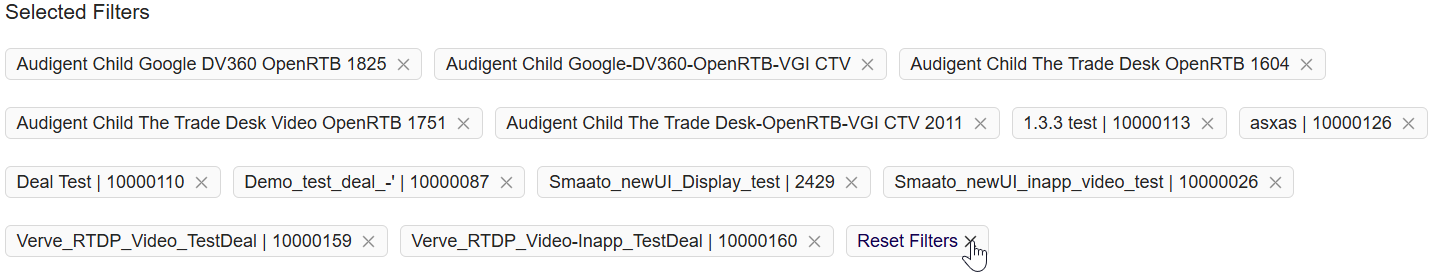
Reset All Selected Filters
- Click the Run Report button to generate the deal performance metrics based on applied filters.
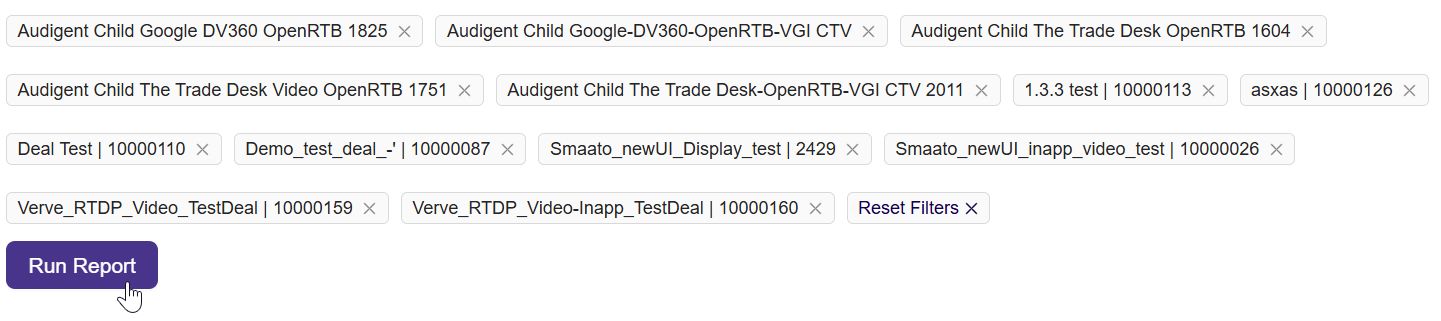
Run Report
- The top section displays key metrics. see the Figure: Showing Filtered Total
- Spend/Revenue: Total spend or revenue.
- eCPM: Effective Cost Per Mille (cost per 1,000 impressions).
- Impressions: Total number of ad impressions.
- Win Rate: Percentage of successful ad bids.
-
The Spend/Revenue graph visualizes day-wise revenue trends. Hover over bars for daily values, see the Figure: Graph Spend Revenue
- Click Select Columns to view and choose which columns to display in the deal table. For column description, see the View Deal Column.
Select Columns To View
- Scroll down to view detailed deal metrics. Use pagination to move between pages. See Figure View Deal Details
- Click the Export Deal Report button to download the data in csv format for offline analysis.
- The preview of deal report in csv format appears as below:
Deal Report
Last Modified: September 18, 2025 at 9:09 am