SDX Reporting
Here you will find all of the details for check the performance of your SDX Ad Campaigns using the Smaato Reporting Analytics.
Please also see the SDX Analytics Glossary at the end of the page for descriptions of the reporting analytic metrics we use.
Inventory and My Bids
To get in-depth insights into your campaigns, click on the “Reporting” tab at the top.
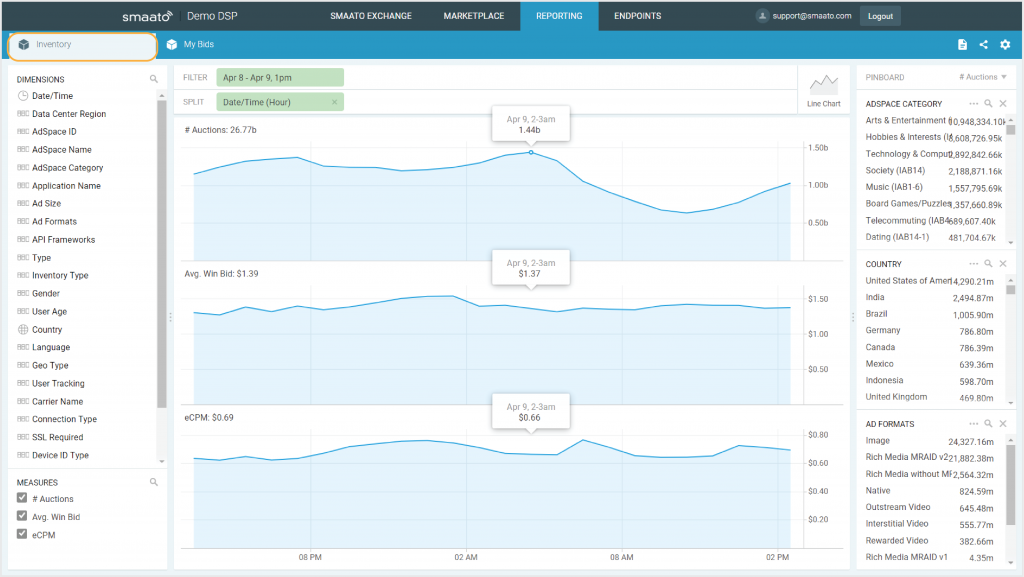
If you choose the Inventory tab, you can discover all available inventory on the Smaato Exchange.
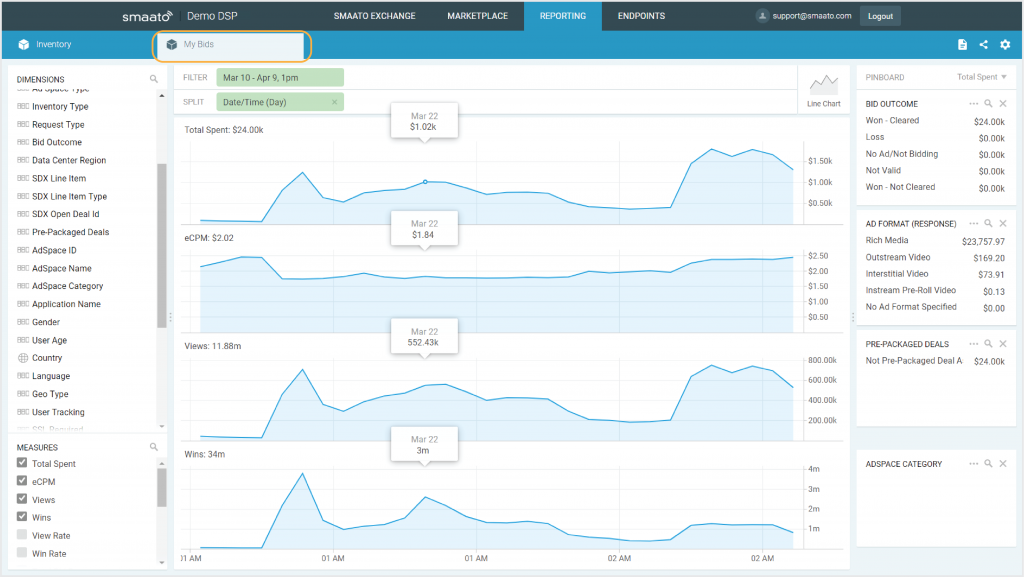
If you select the tab for My Bids, you will find your bid performance.
Dimensions and Measures
Dimensions are information types that can be used within reporting by which data can be filtered or split.
Measures are KPIs for which values can be displayed for reports based on the aforementioned dimensions.
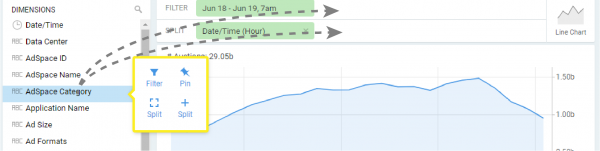
To filter or split by a dimension, you can either drag and drop the dimension into the respective column or click on the dimension. Clicking presents the following options:
- Filter: Adds this dimension as a filter
- Pin: Adds this dimension to the pinboard
- Split: Creates a split based on this dimension
- Split +: Adds a split by this dimension
To use a measure, enable or disable it using the checkbox next to it.
Filters
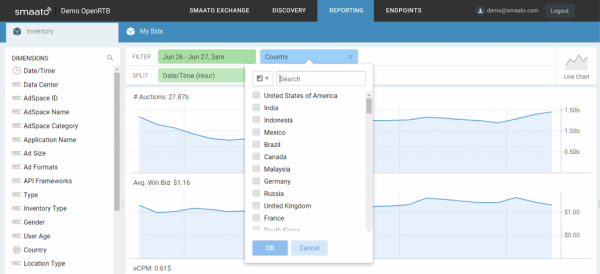
Using Reporting you can view specific metrics, i.e. “Show me spend and eCPM only for specific countries”.
Click on the Dimension and select Filter and the metric will be added to the filter section.
From here you just need to select the specific values from the list.
Date and Time Filters
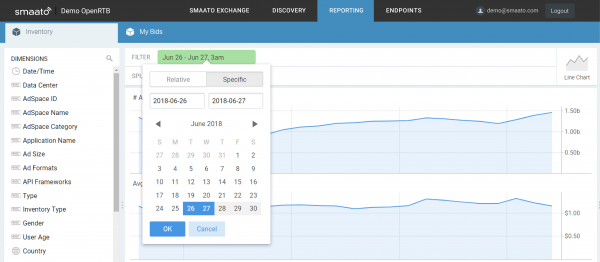
You can also select and report a specific date and/or time by simply clicking the green date/time tab in the selected filters section.
From here you can select specific dates ranges from the calendar.
Date and Time Comparison
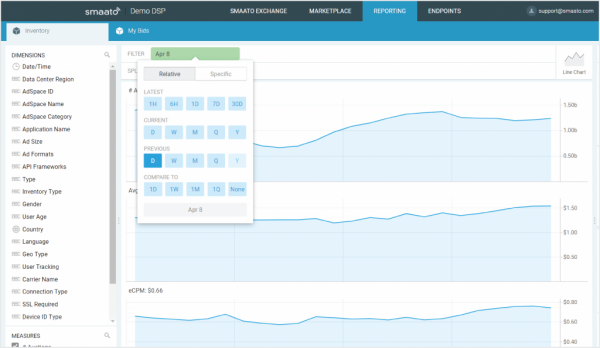
You can also compare a date and time period to a previous date and time using the relative and previous day (D) element of the date/time filter.
i.e. “I want to compare yesterday to the day before”. Here you can see the comparison April 8 to the previous day (April 7).
Value Split
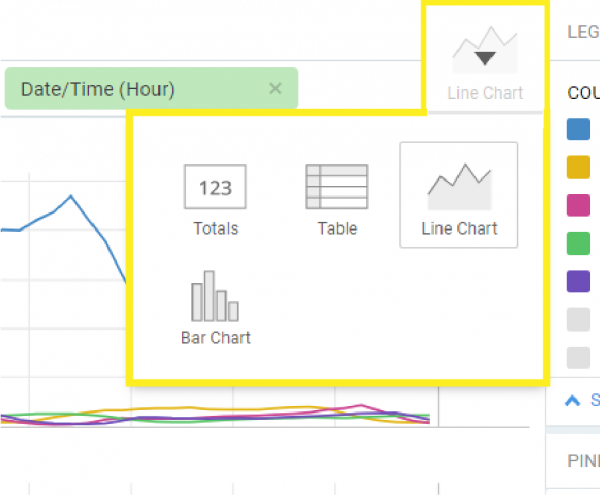
If you would rather see a breakdown of all the values of a dimension, (i.e. “show me spend and eCPM for all countries by country”), use the dimension in the split column instead. You can do this for both Inventory and My Bids. You can also switch those queries to a different visualization, such as a table or a bar chart.
To select, click on the line graph icon next to the filter and split rows, and there you will see the visual selections.
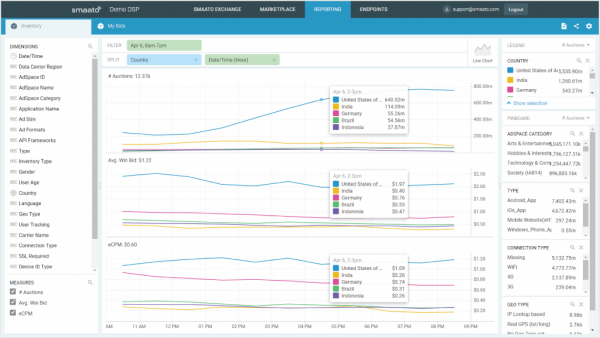
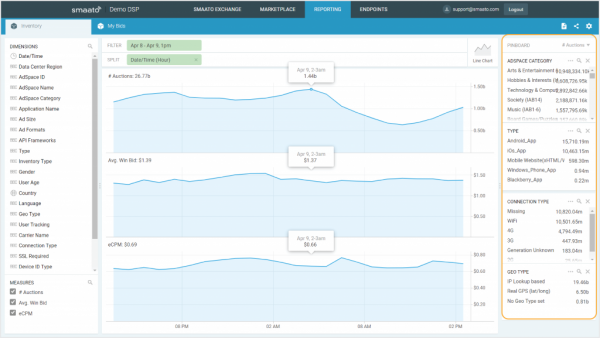
Here is an example view of the line graph:
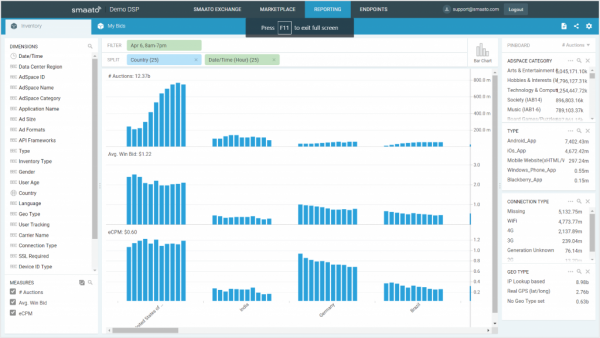
Here is an example view of the bar graph:
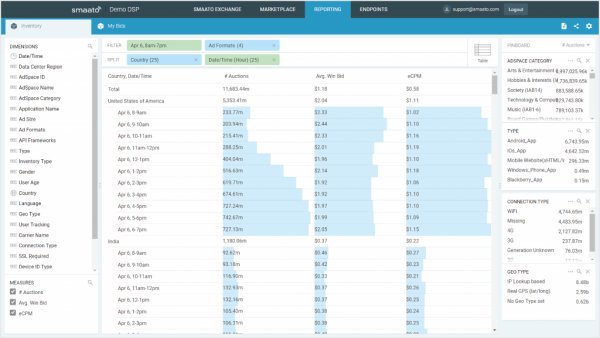
Here is an example view of the table:
Pinboard
On the right-hand side of the dashboard, you will find the Pinboard. This is where you can list specific Dimensions values.
To add a Dimension to the pinboard, simply click on a metric and select Pin or click and drag to the pinboard.
To remove pins, click the “X” at the top right of a Pin:
SDX Analytics Glossary
Dimensions
| Dimension | Description |
|---|---|
| Gender | Users by gender. |
| User Age | Users by age ranges of 4-9 years (e.g. 13-17, 18-24, 25-34, 35-44…). |
| Inventory Type | Traffic segmented by In-app or mobile web. |
| Total Spent | Total spend on the exchange. |
| Date/Time | Time as a dimension, to be used as a filter or split. |
| eCPM | The overall effective Cost Per Mille (i.e. per 1000 impressions). |
| Data Center | The data center(s) in use; possible values are US-East, EU-West, APAC. |
| Request Type | Request type, i.e. open auction, private marketplace etc. |
| Win Rate | Percentage of won auctions over total auctions. |
| View Rate | Percentage of views over-served ads. |
| ZIP % | Percentage of traffic containing ZIP code information. |
| Location % | Percentage of traffic containing location information. |
| GPS % | Percentage of traffic containing GPS information. |
| Clear Rate | Percentage of cleared auctions over total auctions. |
| Bid Outcome |
The outcome of the auction. Possible values are Lost, Won – Cleared, No Ad (Not Bidding), Won – Not Cleared, Not Valid. |
| #Auctions | The number of auctions. |
| Carrier Name | Name of the detected carrier, if available. |
| Seat ID | List of Seat IDs (i.e. IDs used to denote specific advertisers’ seats in DSP bids). |
| Deal ID | List of Deal IDs (i.e. IDs used for transacting PMP deals). |
| Country | List of Countries. |
| Campaign ID | List of Campaign IDs (i.e. IDs used to denote specific campaigns in DSP bids). |
| Location Type | Lat./Long. and/or ZIP code (or none). |
| User Tracking | Enabled or disabled. |
| Device OS | Device’s OS, e.g. iOS, Android, etc. |
| Device Model | Device’s model, e.g. iPhone 5S, Samsung Galaxy Tab, etc. |
| Device Make | Device brand, e.g. Apple, Samsung, LG, etc. |
| Avg. Win Bid | Average win bid in auctions. |
| Avg. Bid Price | Average bid price. |
| Application Name | Apps by names. |
| Device ID Type | Apple IDFA, Google Ad ID, IMEI, etc. |
| Type |
App entity type (OS type or mobile site). Please Note: The App entity denotes a collection of adspaces that belong to the same property, i.e. an app or a mobile site. Accordingly, mobile sites are also listed as an “App” type.
|
| Wins | Amount of won auctions. |
| Views | Amount of viewed impressions. |
| Duration | Amount of time for the bid request to be transmitted (in milliseconds). |
| Total Bids | Amount of bids. |
| SDX Line Items | All SDX Line Items in use. |
| Ad Type | All ad types present in available traffic. |
| Ad Size | All ad sizes present in available traffic. |
| Advertiser Domain | Advertiser domains of the bid responses’ creatives. |
| Adspace Type | Adspaces segmented by types (OS type or mobile site) |
| Adspace Name | Adspaces listed by names. |
| Adspace ID | Adspaces listed by IDs. |
| Adspace Category | Adspaces by categories. |
| Ad Type (Response) | Ad types specified in bid responses. |
| Ad Type (Request) | Ad types specified in bid requests. |
| Ad Size (Response) | Ad sizes specified in bid responses. |
| Ad Size (Request) | Ad sizes specified in bid requests. |
Measures
| Measure | Description |
|---|---|
| # Auctions | The number of auctions. |
| Avg. Win Bid | Average win bid in auctions. |
| eCPM | The overall effective Cost Per Mille (i.e. per 1000 impressions). |
| Total Spent | Total spend on the exchange. |
| Views | Amount of viewed impressions. |
| Wins | Amount of won auctions. |
| View Rate | Percentage of views over-served ads. |
| Win Rate | Percentage of won auctions over total auctions. |
| Total Bids | Amount of bids. |
| Avg. Bid Price | Average bid price. |
| Clear Rate | Percentage of cleared auctions over total auctions. |
| GPS % | Percentage of traffic containing GPS information. |
| ZIP % | Percentage of traffic containing ZIP code information. |
| Location % | Percentage of traffic containing location information. |
Video Events
| Measures | Description |
|---|---|
| Video Start | The number of impressions where the video was played. The event is logged once per view. If a user stops play and restarts it, the restart isn’t counted. |
| 25% views | The number of ad plays that played through 25% of the duration of the ad. |
| 50% views | The number of ad plays that played through 50% of the duration of the ad. |
| 75% views | The number of ad plays that played through 75% of the duration of the ad. |
| 100% Views | The number of ad plays that played through 100% of the duration of the ad. |
| Video Errors | The number of times a video response encountered an error while playing. |
| 25% View Rate | 25% Views / Impressions |
| 50% View Rate | 50% Views / Impressions |
| 75% View Rate | 75% Views / Impressions |
| Video Completion Rate | 100% Views/ Impressions |
| Video Error Rate | Errors/Impressions (Percentage of times there was an error for video playback) |
Last Modified: August 31, 2023 at 11:52 am